Console Maven Widgets - Live Testing & Demo
Comprehensive Testing Environment + Marketing Demo
💡 This Page is Preloaded with Test Errors
Important: This testing page automatically generates stress test errors when it loads to demonstrate widget functionality. These errors are intentionally created for testing purposes and do not indicate any real issues with your application.
- ✅ Test Errors Include: Console errors, warnings, API failures, network errors, and resource loading failures
- 🔄 Clear Errors: Click the "Clear All Errors (Testing Mode)" button below to remove all test errors
- 🎯 Purpose: Allows you to immediately see how Console Maven captures and displays errors in real-time
💡 Tip: After clearing errors, use the "Demo Actions" section to manually generate specific error types for targeted testing.
💡 Why Console Maven Widgets?
Real-time error tracking gives you visibility into what's actually happening in your users' browsers - not just your development environment. Console Maven captures errors as they occur, with full context, stack traces, and AI-powered fix suggestions.
⚡ Real-Time Capture
Automatically captures all console errors, warnings, and logs as they occur. No manual integration beyond the script tag.
📍 Stack Trace Analysis
Full stack traces with file names, line numbers, and column positions for precise debugging.
🤖 AI-Powered Suggestions
Get instant fix recommendations powered by AI for common errors (Pro tier).
📦 Installation (< 60 seconds)
<script src="/latest/console-maven-widget-classes.min.js"
data-api-key="YOUR_API_KEY"
data-auto-render="true"></script>
✓ Auto-initializes • ✓ DebugFooter appears automatically • ✓ Starts capturing errors immediately
🎯 The Console Maven Advantage
Intelligent Error Categorization vs. Browser Console
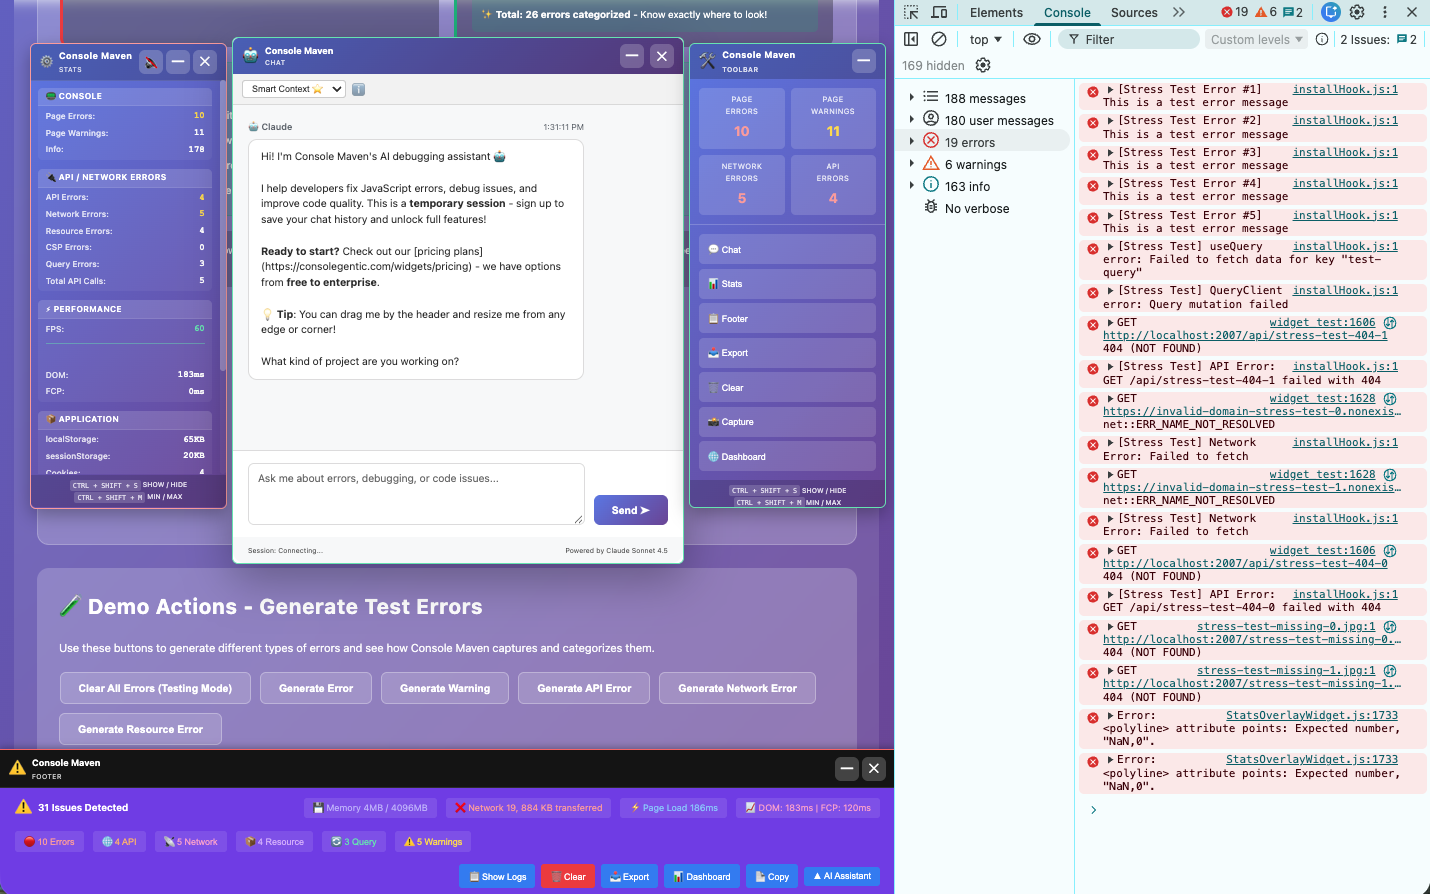
Unlike the browser's DevTools console which lumps all errors together, Console Maven intelligently categorizes errors to give you actionable insights at a glance.
❌ Browser DevTools Console
✅ Console Maven Stats Widget
💡 Why This Matters
- 🎯 Faster debugging: Know if it's an API issue, network problem, or code error
- 📊 Better prioritization: 5 network errors might be one DNS issue, not 5 separate problems
- 🔍 Actionable insights: Resource errors? Check your CDN. API errors? Check your backend
- ⚡ Real-time transparency: See exactly what's happening in your app without digging through console logs
Try it yourself: Open your browser's DevTools Console (F12) and compare the error counts with the Stats Widget → You'll see Console Maven provides much more useful categorization!
📸 See It In Action

Click to view full size: Console Maven widgets with browser DevTools Console comparison
🧪 Demo Actions - Generate Test Errors
Use these buttons to generate different types of errors and see how Console Maven captures and categorizes them.
Use the buttons below to render, test, and destroy each widget. Click Render to initialize a widget, then switch to the "Console Playground" tab to trigger errors and see how each widget captures and displays them.
DebugFooter Widget Inactive
Fixed footer bar for real-time error monitoring
The DebugFooter provides a persistent bottom bar that displays error counts and recent console messages. Perfect for development environments where you need constant visibility into application health.
- Live Updates: Shows real-time error/warning counts
- Recent Messages: Displays the last 5 console messages
- Minimal UI: Stays at the bottom, non-intrusive
- Color Coded: Red for errors, yellow for warnings
Position: Fixed bottom | Auto-updates: Yes
Toolbar Widget Inactive
Quick action toolbar for debugging
A floating toolbar that provides instant access to debugging actions like clearing errors, taking screenshots, and accessing the dashboard. Can be minimized to save space.
- Clear Errors: Reset error tracking session
- Screenshot: Capture page state with errors
- Dashboard Link: Quick access to full dashboard
- Minimizable: Collapse to icon when not needed
Position: Top-right | Draggable: No
StatsOverlay Widget Inactive
Comprehensive error statistics overlay
Displays detailed statistics about errors, warnings, and browser metrics. Shows error breakdown by category, application storage usage, and browser warning types.
- Error Categories: Console, API, Network, Resource, CSP, Query
- Browser Warnings: Deprecation, intervention, CSP violations
- Storage Metrics: localStorage, sessionStorage, cookies
- Performance: Memory usage, service worker status
Position: Top-left | Collapsible: Yes
Agentic Assistant (ChatWidget) Inactive
AI-powered debugging assistant
An intelligent chat interface that helps debug errors in real-time. Ask questions about errors, get fix suggestions, and receive contextual help based on captured console data.
- AI Analysis: Get instant error explanations
- Fix Suggestions: Receive code fixes for common errors
- Context Aware: Understands your error history
- Interactive: Ask follow-up questions
API: localhost:2007 | Position: Center modal